Kronos on the NIFTY50
Kronos is an open-source foundation model for candlestick data. I tested whether its forecasts could rank Indian stocks better than simple baselines, and whether a portfolio built on them could beat an index tracker after fees and tax. Across four pre-registered rounds, nothing cleared the bar I had set in advance.
Most of the model's score turned out to be mechanical: about 70% of it was reversion toward its own 90-bar normalisation window, and it showed no measurable ranking signal on the NIFTY 200. Its hidden states carried a faint signal, but not enough to beat a random-weights control. A simulated ₹10 lakh portfolio did make money. So did 79 of 500 random stock-pickers.
Claim under test
Kronos — shiyu-coder/Kronos, MIT licence
- Published claim
- The authors call Kronos the first open-source foundation model for financial candlesticks: a 102M-parameter transformer pre-trained on 12 billion bars across 45 exchanges. They report zero-shot forecasts with a rank IC (how well predicted and actual rankings agree) well above existing baselines, lower volatility error, and cleaner synthetic candles. The repository also ships a qlib pipeline that finetunes, ranks stocks, and holds the top k, offered as a demo rather than a trading system.
- What I tested
- The stock-picking recipe as published: daily scores from forecasts, rank Indian large and mid caps, hold top-k baskets after costs, with the S&P 100 as a cross-check. Then, in Round 4, whether the model's hidden states carry predictive information, and whether a simulated ₹10 lakh account beats an index tracker after costs and tax.
- What I found
- No measurable cross-sectional signal on the NIFTY 200 from the published recipe; about 70% of its output was local window normalisation. The hidden state had a faint signal (rank IC +0.03, t = 3.6 on 200 names) but did not beat the random-weights control it was pre-registered against, and gave no tradeable edge on 50 names. These are ranking tests and simulations, not live trading. I did not re-run the paper's volatility or synthetic-candle benchmarks.
Problem
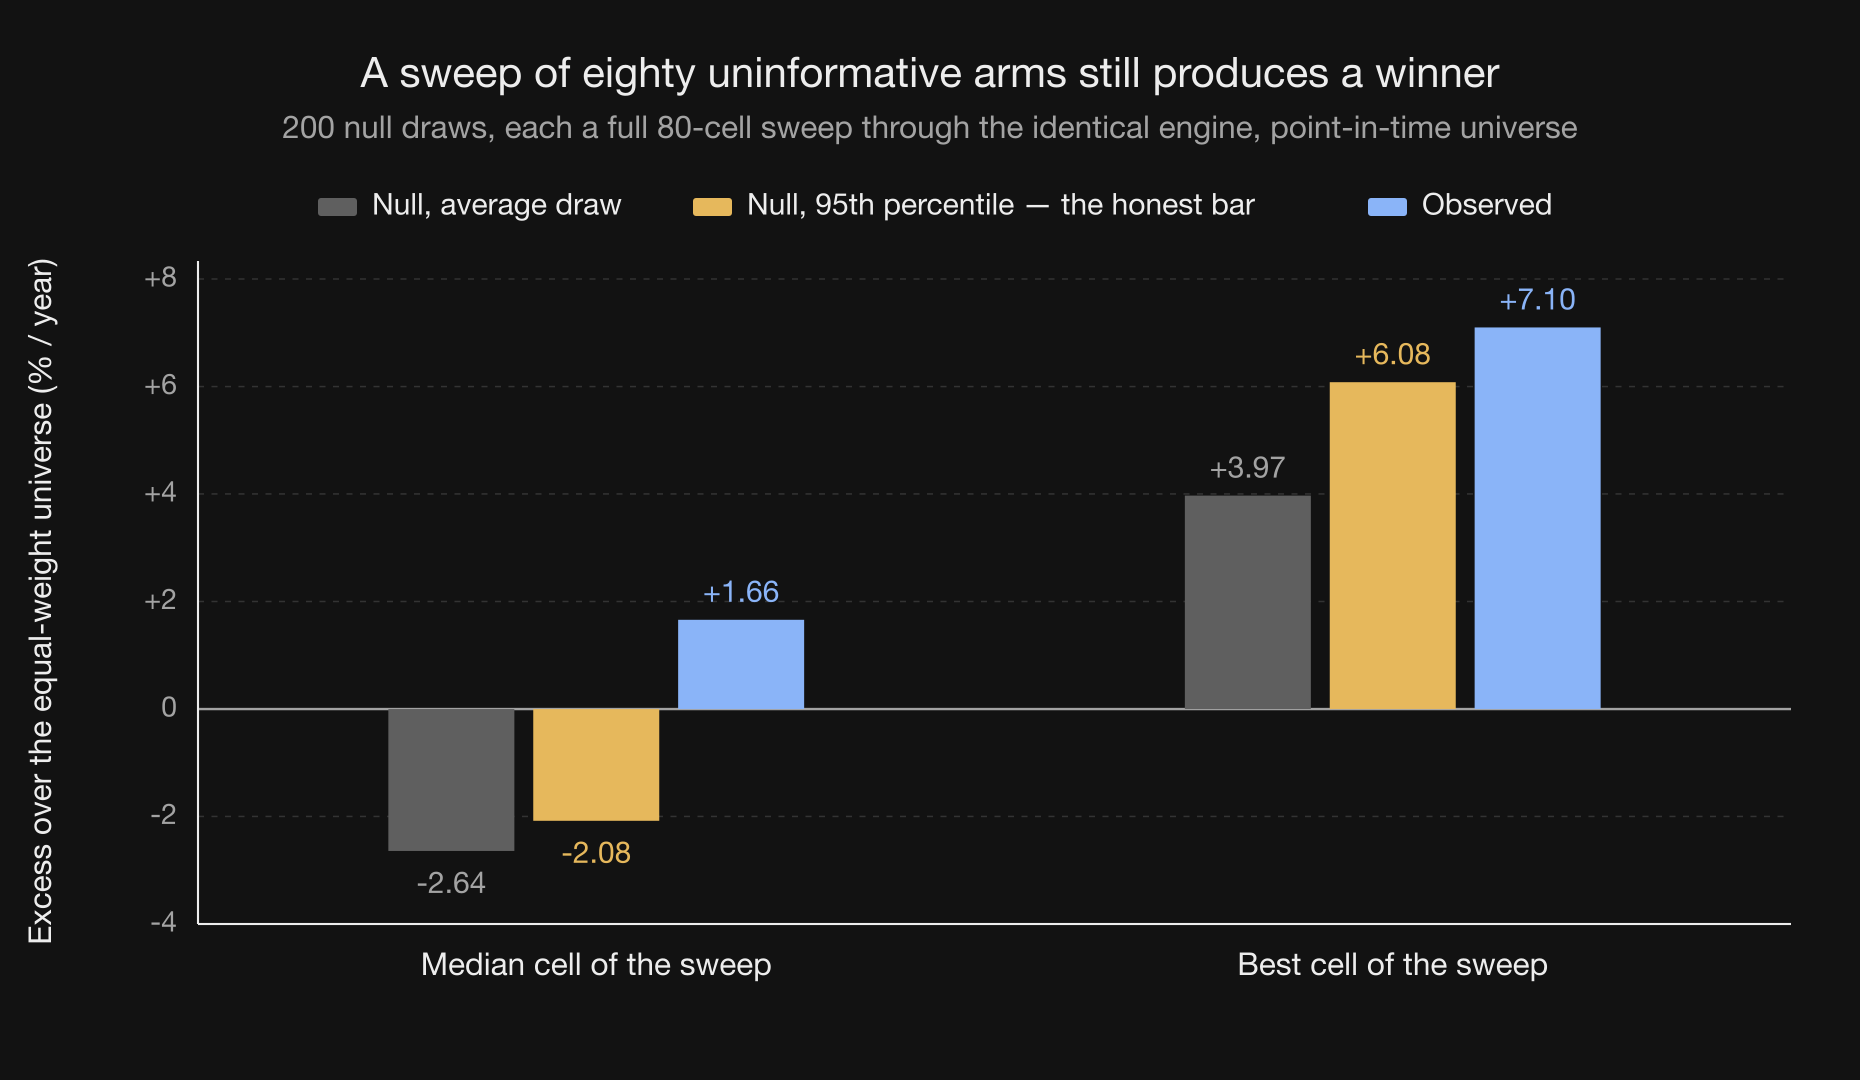
A profitable backtest is easy to get by accident: use today's index members for past dates, compare an equal-weight portfolio to a cap-weighted index, understate costs, or report the best of many runs. So before treating any return as evidence, I wrote down what would count as a pass.
Two questions. Does Kronos rank returns across stocks better than free, simple features? And would that signal survive Indian retail costs, meaning Securities Transaction Tax, capped brokerage, depository charges, and short-term capital gains tax?
Approach
- Pass/fail criteria went into PREREG.md before any IC was computed: confidence intervals clear of zero, better than shuffled scores and simple momentum/reversal baselines, and lower validation loss after finetuning. Round 4 added cutoffs for the execution and futures tests.
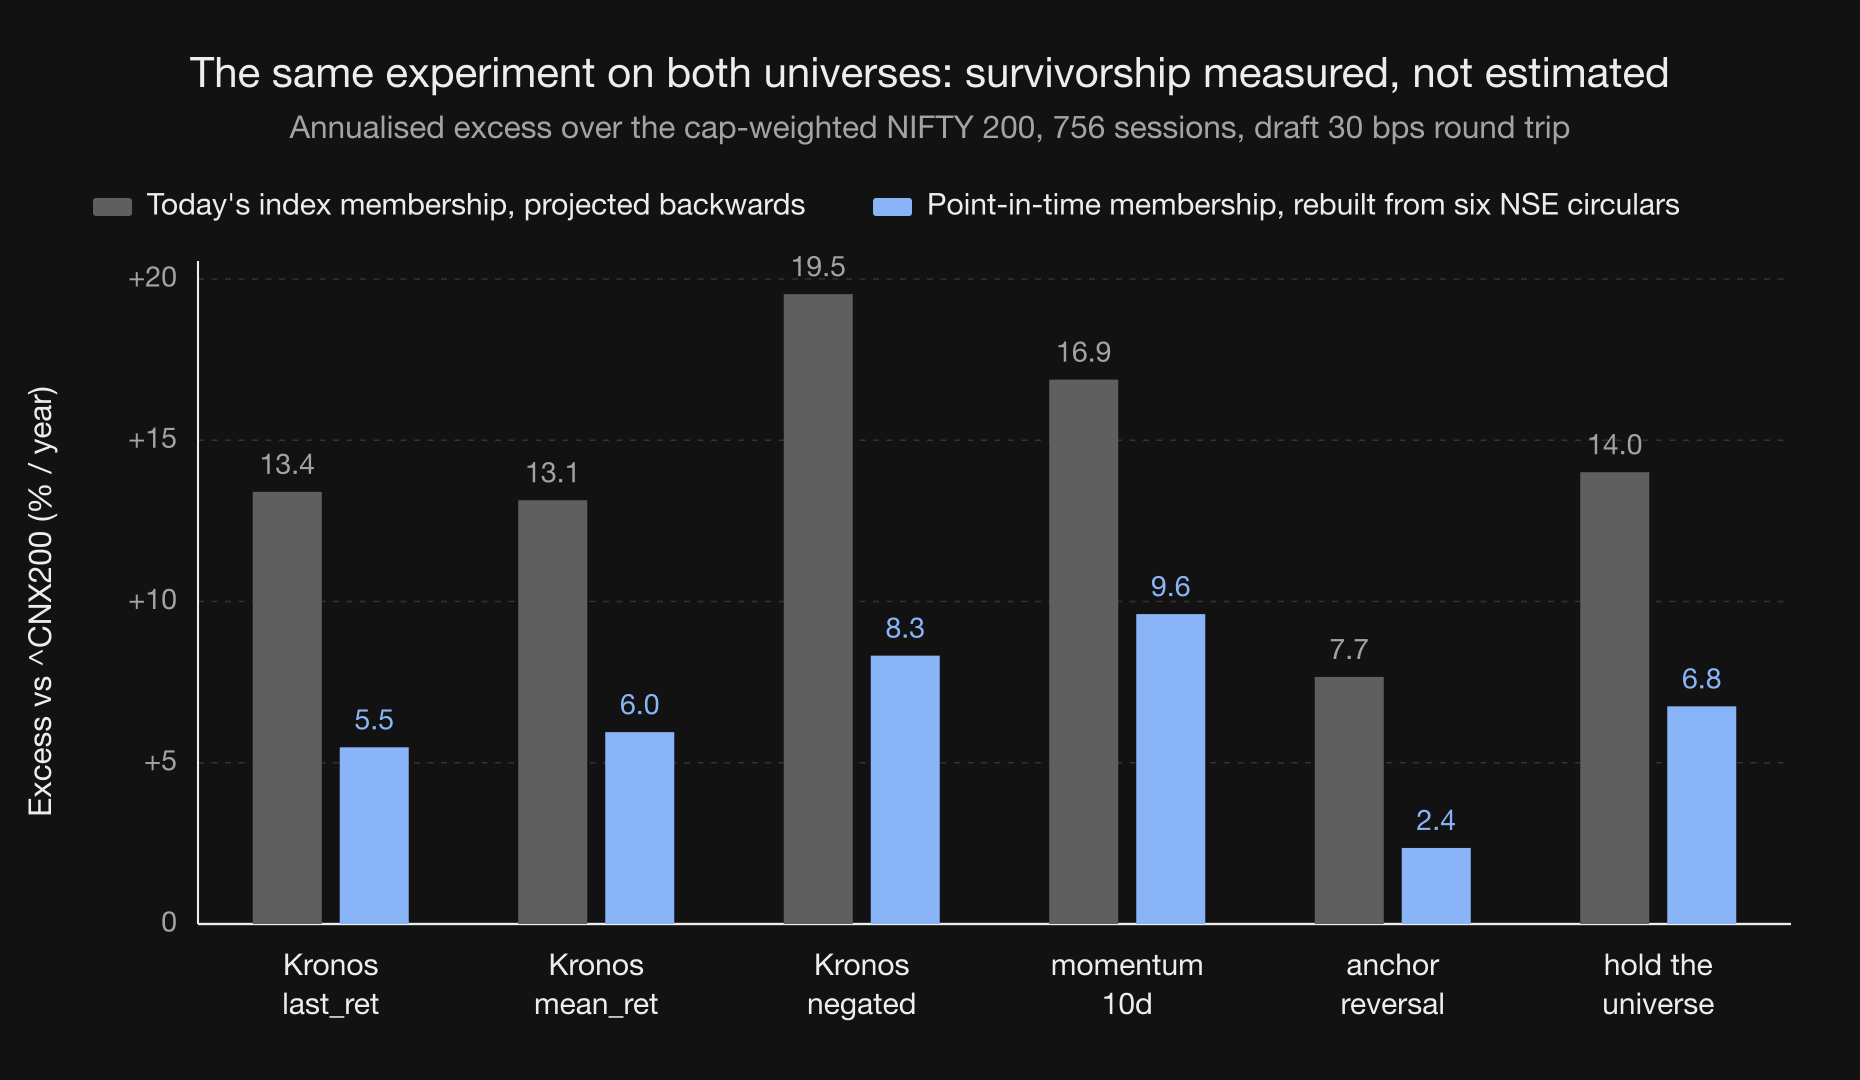
- Historical index membership came from NSE reconstitution circulars: 259 names for the NIFTY 200 over the period, 57 for the NIFTY 50. Fee schedules put a round trip at 27.4 bps on a ₹10 lakh leg and 89.8 bps on ₹10,000, because flat depository charges and brokerage caps punish small tickets.
- I reimplemented the repository's scoring recipe with leakage assertions: context ends at the close of day t, the score is made at t, the trade fills at the open of t+1. A port of qlib's TopkDropoutStrategy passed 17 unit assertions. Perfect foresight gave an IC of 1.0; shifting the signal one day removed 64 points of annual return.
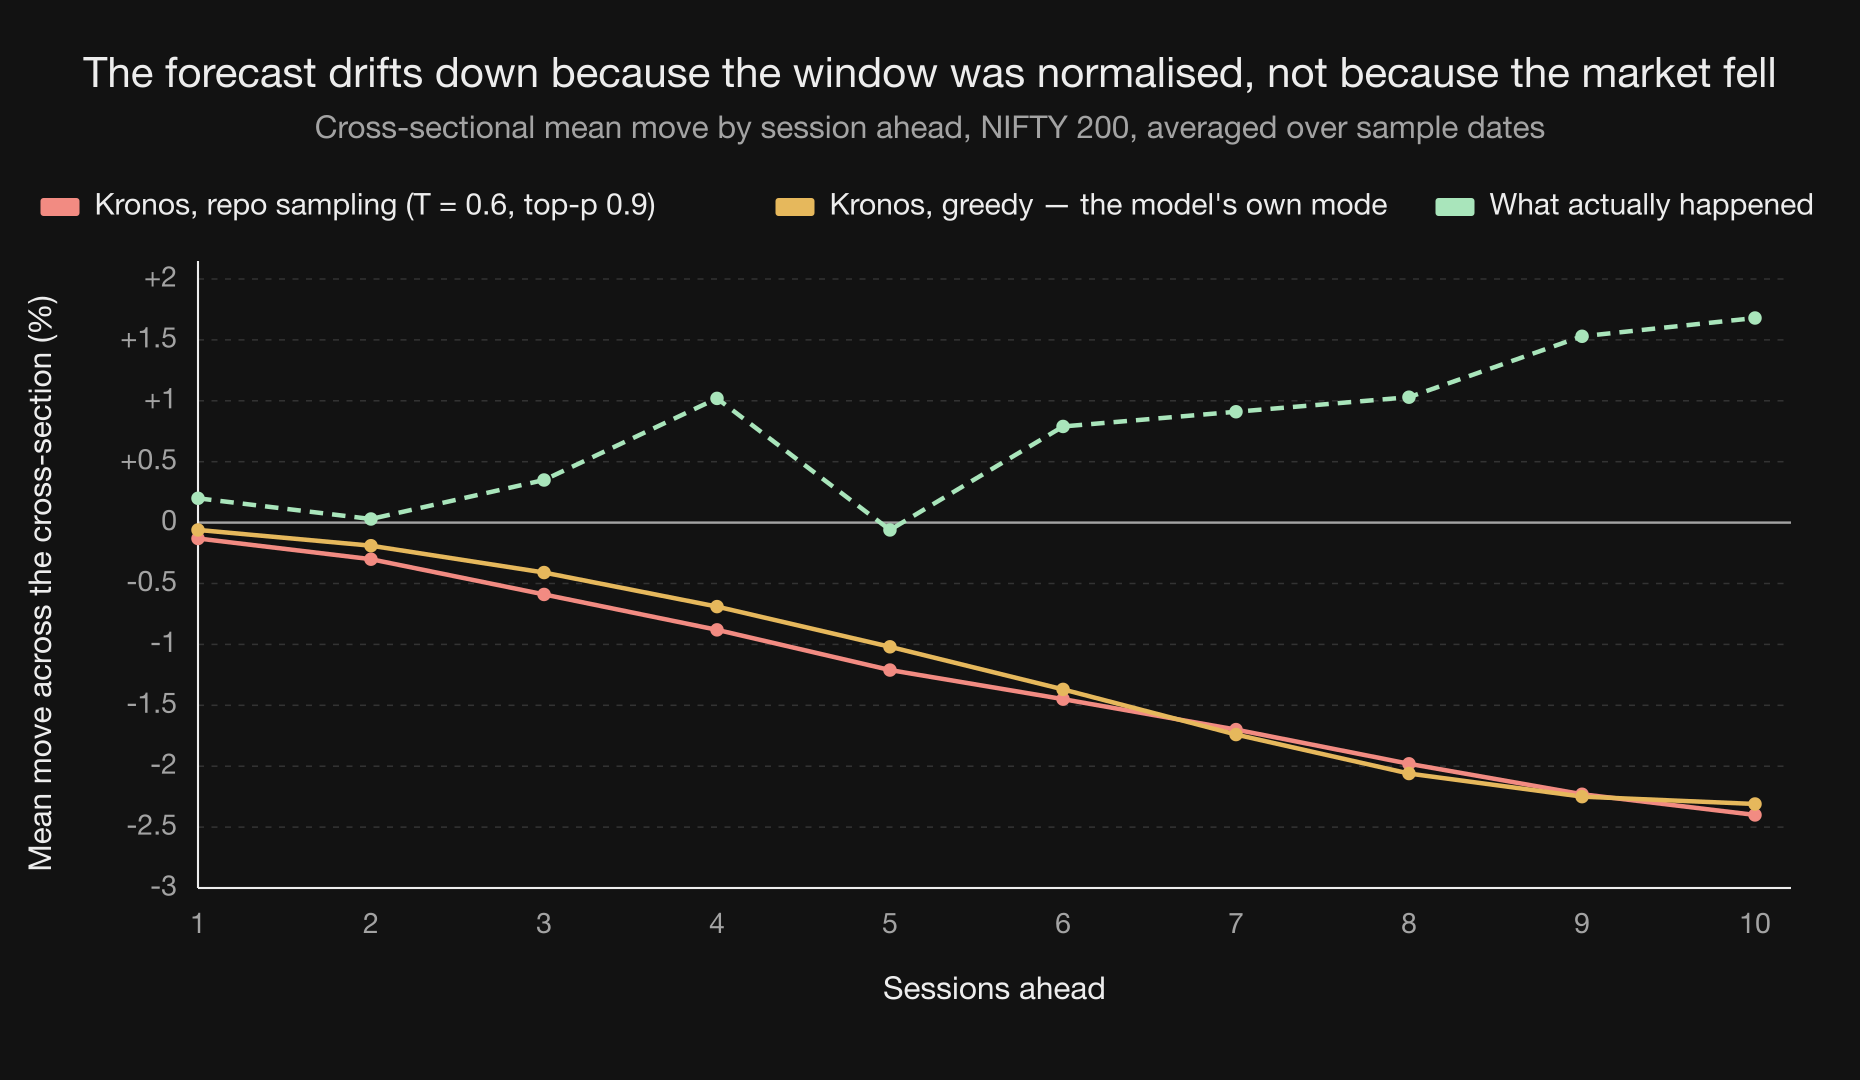
- To see what the score actually measured, I regressed it on each stock's position in its own 90-day window, (close − mean₉₀)/std₉₀, over 144k stock-dates. R² 0.70, slope −0.70. Greedy decoding gave the same picture (58.6%), and so did the S&P 100 (68.9%).
- Round 4 skipped the sampler and read the model's final hidden state directly: frozen causal PCA to 32 components, then a daily Fama–MacBeth ridge fitted on the NIFTY 200 and applied to the NIFTY 50. I tried 26 readout variants across layers, token pools, model sizes, and heads, never touching the base weights.
- Controls ran through the same pipeline: random-weight reservoirs, a 22-feature baseline block, and the raw 90×6 window. Before that I fixed gaps from earlier rounds: permutation estimators aligned with observed ICs, Newey–West lags raised to 20, three separate seeds.
- The portfolio simulation held the top 10 NIFTY 50 names, rebalanced weekly through qlib TopkDropout, on ₹10 lakh. Costs used Zerodha CNC fees for ₹1 lakh tickets (14.4 bps one way); tax used FIFO lots under both STCG and business-income rules. The comparison was an index ETF.
- An equal-weight basket can beat a cap-weighted index with no skill at all, so I also graded it against 500 random stock-pickers. A separate script re-derived every Round 4 number, with 166 passing unit tests behind it.
Results
- Rounds 1–3: no measurable cross-sectional signal on the NIFTY 200. Zero of 48 parameter-horizon cells were significant. The primary 10-day rank IC was −0.0041, t = −0.35, bootstrap CI [−0.025, +0.020]. The strategy trailed equal-weight buy-and-hold and turned the book over 11 times a year.
- Reversion to the 90-bar window explained 70.1% of the score (58.6% greedy, 68.9% on the S&P 100). Per-window z-scoring helps train the transformer; it also scrambles ranking across stocks. A 1,200-step finetune on NSE data cut the artifact (−17.6% correlation) without surfacing a signal.
- Evaluation choices moved the headline numbers a lot. Point-in-time index membership took 9.05% off annualized return. Published costs made the best signal unprofitable (1-day reversal: IC +0.028, −5.45% net). Multiple-testing correction removed 9 of 10 shortlisted setups.
- Round 4: the hidden state ranked stocks, faintly. Rank IC +0.031 on the NIFTY 200 (t₂₀ = 3.55), +0.022 on the NIFTY 50 (t₂₀ = 2.00). Against random weights (+0.024, t₂₀ = 1.97) it missed the pre-registered cutoff of 3.0, and the reservoir's own score moved ±0.01 with the seed.
- The ₹10 lakh book returned +9.2% annualized net against +5.6% for the ETF: +3.6 pp gross, +1.9 pp after tax. That still was not evidence of an edge. 79 of 500 random pickers did as well or better. The futures version failed too: 47.8% top-1 hit rate, a 4 bps gross edge against 432 bps weekly standard deviation, and one −18% week.
- Ranking 50 names did not help choose the top 10. Kronos mostly sorted the losers to the bottom and added nothing at the top (+3 bps spread, t = 0.53). Fifty names is too few to detect a 0.02 signal.
Limits
- Only daily cross-sectional ranking and top-k portfolios were tested. Trajectory shapes, conditional distributions, volume forecasts, and dispersion across sampled futures were not.
- The data runs August 2023 to August 2026, a strong bull market for Indian mid and large caps. Round 4 covers 561 trading days from May 2024, after a 250-day Fama–MacBeth burn-in.
- The Round 4 permutation null is about 1.8× too tight: block-20 date shuffling breaks the 250-session memory in the Fama–MacBeth score (AR(1) autocorrelation 0.46 observed against 0.007 under the null). The block-20 bootstrap intervals were used for the hard cutoffs instead.
- Finetuning got 90 minutes on one machine, 182 tickers, 7 years of daily bars. Three tickers lacked clean history; NSE's temporary demerger placeholders were dropped.
- Costs and taxes are an operating model, not advice: fees follow published exchange circulars, futures use spot minus a flat carry, and margins assume baseline levels rather than full SPAN ramps.
Metrics
- significant IC cells, model's own score
- 0 of 48
- of the score is 90-bar mean reversion
- 70.1%
- hidden-state rank IC on 200 names, +0.031
- t = 3.55
- percentile of the ₹10 lakh book against 500 random pickers
- 84th
Context
- pass/fail set before any result
- Pre-registered
- the model's own score, then its hidden state
- Four rounds
- NIFTY 200 and NIFTY 50 universes, S&P 100 as a check
- Point-in-time
Architecture
- Pass/fail criteria written before any result
- Index membership and costs rebuilt from NSE circulars
- Rounds 1–3: the model's own score, top 50 held
- Score regressed on its own normalisation window
- Round 4: hidden state → causal PCA-32 → Fama–MacBeth ridge
- Controls: random weights, free features, raw window
- ₹10 lakh weekly book with tax; one-lot futures
- Graded against 500 random pickers
From the run
Three figures from Rounds 1–3: forecasts against what happened, what point-in-time index membership does to returns, and the return hurdle after an 80-cell search. That 80-cell search is separate from the 48 scoring setups above.